9.20.2010

Memory Dump to the Rescue

Surely you’ve been through those situations where a user or a tester reports a situation that you can’t reproduce in your development environment. Even if your environment is properly set up, some bugs (such as a Heisenbug) can be very difficult to reproduce. Sometimes you even have to diagnose the program in the testing/production environment! Those are the times you wish you had a dump of the process state when the bug occurred. Heck, you’ve even read recently that Visual Studio 2010 allows you to open memory dumps, so you don’t even have to deal with tools like windbg, cdb or ntsd!
Wouldn’t it be great if you could instruct your program to generate a minidump when it stumbles upon a catastrophic failure? 
Microsoft supplies a Debug Help Library which among other features, allows you to write these memory dumps. The code below is a .NET wrapper to this particular feature, which allows you to easily create a memory dump. 
Note however that the target assembly must be compiled against .NET 4.0, otherwise visual studio will only be able to do native debugging.


Having the code to write a dump, let’s create an error situation, to trigger the memory dump creation. Let’s just create a small program that try to make a division by zero.

Running this program will throw an obvious DivideByZeroException, which will be caught by the try catch block and will be handled by generating a memory dump.

Let’s go through the process of opening this memory dump and opening it inside Visual Studio 2010. When you open a dump file in VS, it will present a Summary page with some data about the system where the dump was generated, the loaded modules and the exception information.
Note that this summary has a panel on the right that allows you to start debugging. We’ll press the “Debug with Mixed” action to start debugging.


Starting the debug of a memory dump will start debugger with the exception that triggered the dump, thus you’ll get the following exception dialog:


After you press the “Break” button, you’ll be shown the source code as shown below. Note the tooltip with the watch expression “$exception” (you can use this expression in the immediate or the watch window whenever you want to check the value of the thrown exception, assuming somewhere up in the stack you are running code inside a catch block) where you can see the divide by zero exception that triggered the memory dump.

You can also see the call stack navigate through it to the Main method where the exception was caught. All the local and global variables are available for inspection in the “Locals” and “Watch” tool windows. You can use this to help in your bug diagnosis.


The approach explained above automatically writes a memory dump when such an error occurs, however there are times when you are required to do post-mortem debugging in applications that don’t automatically do this memory dumping for you. In such situations you have to resort to other approaches of generating memory dumps. 
One of the most common approaches is using the debugger windbg to achieve this. Let’s see how we could have generated a similar memory dump for this application. If we comment the try catch block and leave only the division by zero code in our application, it will throw the exception and immediately close the application. Using windbg to capture such an exception and create a memory dump of it is as simple as opening windbg, selecting the executable we’ll be running:


This will start the application and break immediately (this behaviour is useful if we want to set any breakpoints in our code). We’ll order the application to continue by entering the command “g” (you could also select “Go” from the “Debug” menu). 


This will execute until the division by zero throws the exception below. When this happens, we’ll order windbg to produce our memory dump with the command ‘.dump /mf “C:\dump.dmp”’.


After this your memory dump is produced in the indicated path and you can open it in visual studio as we’ve previously done.
Post-mortem is a valuable resource to debug some complex situations. This kind of debugging is now supported by Visual Studio, making it a lot easier, even though for some trickier situations you’ll still need to resort to the power of native debuggers and extensions like SOS.

9.16.2010

Code Access Security Cheat Sheet

Here’s one thing most developers like: Cheat Sheets!
I’ve made a simple cheat sheet about .NET Code Access Security, more specifically about the declarative and imperative way of dealing with permissions.
Bear in mind that this cheat sheet doesn’t cover any of the new features brought by .NET 4.0 security model.
This cheat sheet may be handy for someone who doesn’t use these features often and tend to forget how to use it or for someone studying for the 70-536 exam.

9.07.2010

Viewing __ComObject with a Dynamic View

If you ever had to debug a .NET application that uses COM objects, you've probably added such an object to the Watch window or tryied to inspect it in the Immediate window, just to find out it was a __COMObject type which wouldn't give you any hint about it's members.
Visual Studio 2010 gives you a solution for this problem. They've introduced a feature called Dynamic View. As long as your project is using the .NET 4.0 framework you can now inspect these elements.

Let's take a look at this code:


This code is creating a Visual Studio instance and instructing the debugger to break execution right after the creation so that we can inspect the __ComObject.

There are two ways of doing this:
  • adding "vsObj" to the watch window and expanding "Dynamic View" node 
  • adding "vsObj, dynamic" to the watch window


Also note that if your object contains other __COMObjects you can inspect them in the same way as show here in the "AddIns" property.


This "Dynamic View" feature was developed mainly to inspect dynamic objects (another new feature from .NET 4.0). That's where its name comes from.

9.06.2010

RIP : Object Test Bench

After spending some time looking for Object Test Bench in VS2010 menus, I've decided to do a quick search and found this VS2010 RIP list where Habib supplies a partial list of the features removed in VS2010. I was surprised to find out they have removed Object Test Bench!
It's not as if I really needed it, there's nothing I would do with it that I can't do with Immediate window, but I did use it from time to time for some lightweight testing. I guess I won't be using it anymore, will I?
But maybe you'll be more surprised to find out they also removed intellisense for C++/CLI!!!

9.03.2010

Refactoring with NDepend

I’ve recently been granted an NDepend Professional License, so I’ve decided to write a review about it. I took this opportunity to refactor one application I’ve been working on, which suddenly grew out of control and needed a major refactor.

Note: This article is mainly focused on NDepend, a tool that supplies great code metrics in a configurable way through it’s Code Query Language. If you don’t know this tool, jump to http://www.ndepend.com/ and find out more about it.

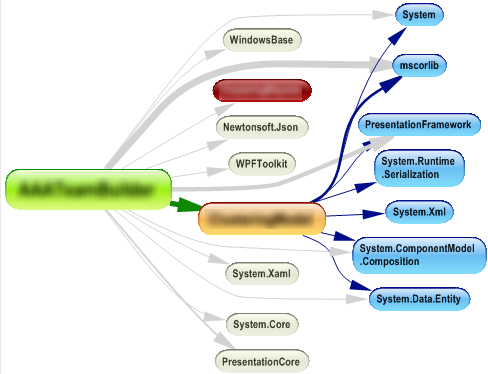
This application grown out of control pretty quickly and one of the things I wished to do in this refactoring is split the assembly in two or three logical assemblies. For this, I’ve decided to use ndepend’s dependency matrix and dependency graph to evaluate where was the best place to split the assemblies. I validated the number of connections I would have between the assemblies to split. For a handful of classes I decided some refactoring was needed in order to reduce the number of dependencies between assemblies. Refactoring these classes allowed me to reduce coupling between the assemblies while increasing the assemblies relational cohesion (the relations between the assembly types) which was lower than it should. There is a metric for this relational cohesion which I used to evaluate how far I should go.
Dependency Graph of all the assemblies envolved (I've blurred the names of my assemblies for obvious reasons)

Further inspection of the dependency matrix led me to the conclusion that my model-view-controller was being violated in a few places, so I added a TODO comment in those places. I’ll fix that after this major refactoring is done to avoid too many refactorings at once (remember that one of the thumb rules about refactoring is doing it in baby steps to avoid the introduction of errors in a previously working codebase).

Next it was time for some fine-grained refactorings. This is where the NDepend code metrics were most valuable. I don’t want to go into too much detail here, so I’ll just pick a few of the metrics I used and talk about them.

First metrics I decided to look were the typical metrics that target code maintainability. Metrics such as “Cyclomatic Complexity” and “Number of lines of code”. No big surprises here. I found two methods that tend to show up in the queries, but these are methods that contain complex algorithm implementations which aren’t easy to change in a way that would improve this statistics. These are some important metrics, so I tend to check them first.

Onward to another interesting metrics...
Some Code Metrics
Efferent coupling
This metric told me something I had forgotten: I suck at designing user interfaces! I tend to crumple a window with a bunch of controls, instead of creating separate user controls where appropriate. Of course that generally produces a class (the window) with too many responsibilities and too much code (event handling/wiring). Also the automatically generated code-behind for these classes tends to show up repeatedly across several code metrics.

Dead code metrics
These allow you to clean dead code that’s rotting right in the middle of your code base, polluting the surrounding code and increasing complexity and maintainability costs. Beware however that NDepend only marks *Potentially* dead code. Say that you are overriding a method that’s only called from a base class from a referenced assembly: since you have no calls to that method and the source to the base class where the method is called is absent from the analysis, that will lead NDepend to conclude that the method is potentially dead code, it doesn’t mean however that you are free to delete it. Also remember a method can be called through reflection (which pretty much makes it impossible for a static analysis tool to say your method is definitely dead code), so think twice before deleting a method, but think! If it’s dead code, it’s got to go!

Naming policy metrics
Here I started by changing some of the rules to fit my needs. Example, naming convention constraints define that instance fields should be prefixed by “m_”, while I tend to use “_”. These are the kind of metrics that are useful to do some code cleanup and make sure you keep a consistent code styling. NDepend pre-defined naming conventions may need to be customized to suit the code style you and your co-workers opted for. As good as these naming conventions rules can be, they’re still far from what you can achieve with other tools suited specifically for this. If you’re interested in enforcing a code style among your projects I would suggest opt for alternatives like StyleCop, however for lightweight naming convention NDepend might just suit your needs.

Note: Don’t get me wrong, I’m not saying that my convention is better or worse than the one NDepend uses. When it comes to conventions I believe that what’s most important is to have one convention! Whether the convention specifies that instance fields are prefixed by “m_” or “_” or something else is another completely different discussion…

A Nice Feature not to be overlooked
I know the hassle of introducing these kind of tools on a pre-existant large code base. You just get swamped in warnings which in turn leads to ignoring any warning that may arise in the old or in the code you develop from now on. Once again NDepend metrics come to the rescue, meet “CodeQuality From Now!”. This is a small group of metrics that applies to the new code you create, so this is the one you should pay attention if you don’t want to fix all your code immediately. Improving the code over time is most of the times the only possible decision (we can’t stop a project for a week and just do cleanup and refactorings, right?) so while you’re in that transition period make sure you keep a close eye on that “CodeQuality From Now!” metrics, because you don’t want to introduce further complexity.

Visual NDepend vs NDepend Visual Studio addin
I also would like to make a brief comment about Visual Studio integration and how I tend to use NDepend.
While having NDepend embed in visual studio is fantastic I found that I regularly go back to Visual NDepend whenever I want to investigate further. I would say that I tend to use it inside Visual Studio whenever I want to do some quick inspection or to consider the impacts of a possible refactoring. Anything more complex I tend to go back to Visual NDepend mainly because having an entire window focused on the issue I’m tracking is better than having some small docked panel in visual studio (Wish I had a dual monitor for visual studio!)

Feature requests
I do have a feature request. Just one! I would like to be able to exclude types/members/etc from analysis, and I would like to do it in the NDepend project properties area. A treeview with checkboxes for all members we want to include/exclude from the process would be great. I’m thinking in the treeview used in some obfuscator tools (eg: Xenocode Obfuscator) that contain the same kind of tree to select which types/members should be obfuscated.
This is useful for automatically generated code. I know that the existing CQL rules can be edited in a way to exclude auto-generated code, but it’s a bit of a hassle to handle all that CQL queries. Another alternative would be to “pollute” my code with some NDepend attributes to mark that the code is automatically generated, but I don’t really want to redistribute my code along with NDepend redistributable library.
Also, my project has a reference which is set to embed interop types in the assembly (a new .NET feature) and currently there is no way (at least that I know of) to exclude these types from analysis.

Conclusions
Ndepend will:
- make you a better developer
- enforce some best practices we tend to forget
- improve your code style and most important code maintainability

There are many other interesting NDepend metrics and features beside metrics I didn’t mention. I picked just a bunch of features I like and use, I could have picked some others, but I think this is already too long. Maybe some other time!
Also note that NDepend is useful as an everyday tool, not just for when you're doing refactorings as I've exemplified.

If you think I’ve missed something important go ahead and throw in a comment.